Managing Lists
In iTop, lists are quite common: many menu items point to lists, the search results displays lists as well as the global search. Once a list of objects is displayed, the operations that can be performed on the list are always the same.
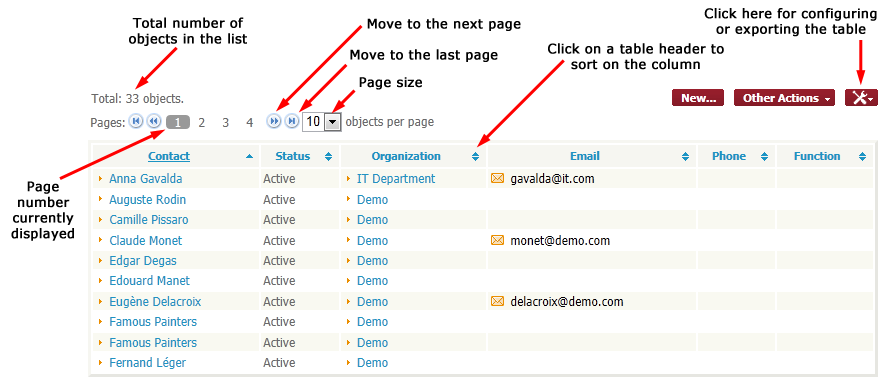
For example, below is a list of Contacts:
If a list contains more than a (configurable) number of elements, it is displayed as a paginated list:
Toolkit menu
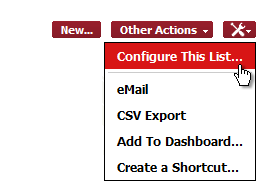
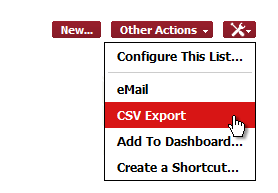
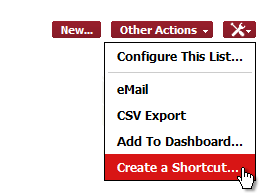
When a list of objects is displayed in iTop, a certain number of operations can be performed on the list itself (without modifying the objects in iTop). These operations are executed through the toolkit popup menu at the top-right of the list.
Configure This List
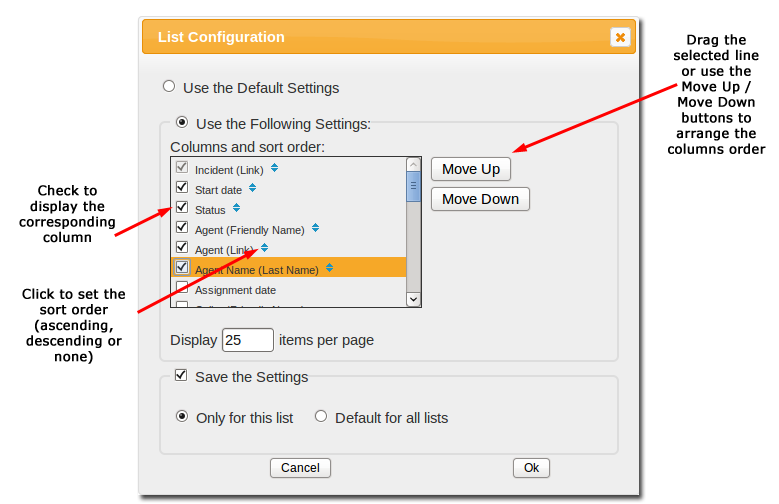
The first possible operation consists in configuring the appearence of the list. You can choose:
-
Which columns are displayed and in which order
-
How the list is sorted
-
How many items will be displayed at the same time (see paginated lists above)
-
To which list this configuration will apply: Only to this specific list, or to all lists which do not already have a specific configuration.
All this configuration is done through the popup dialog:
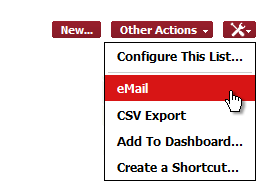
This action is similar to the “eMail” action on the details of an object, except that the hyperlink inserted into the message points to the specified list of objects.
CSV Export
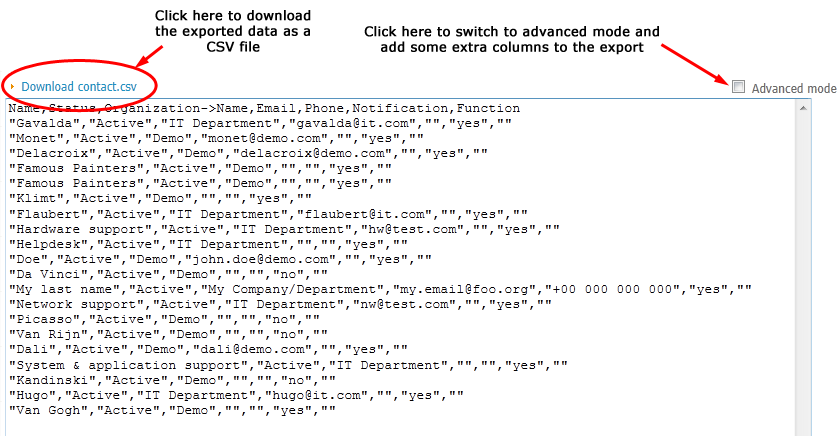
The CSV export operation displays a page containing a text/CSV representation of the objects in the list. This is useful for importing the data in a third party application or to process the data in a spreadsheet before re-importing them into iTop.
You can then either:
-
Use the link at the top-left to download the data as a CSV file, then open this file in your favorite spreadsheet application
-
Copy/Paste the data from the text area (use CTRL-A to select all) then paste it into your spreadsheet
How to paste CSV data in Excel 2007/2010
If you use copy/paste to import CSV data into Excel, all the data are put in just one column. Fortunately this is easy to change.
In the “Data” tab of Excel, click on the “Text To Columns” icon:
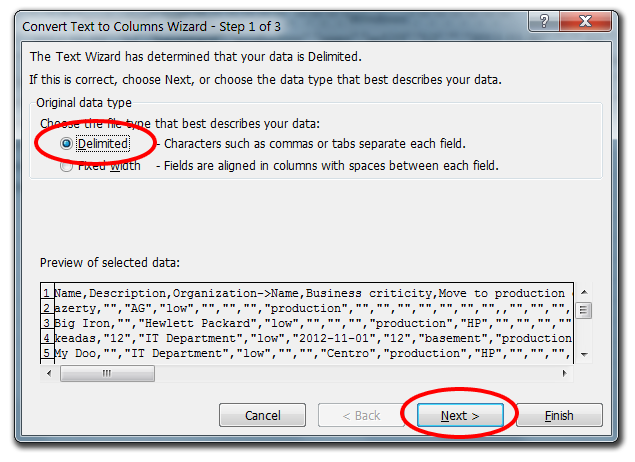
The following dialog wizard appears:
Select “Delimited” and click “Next >”.
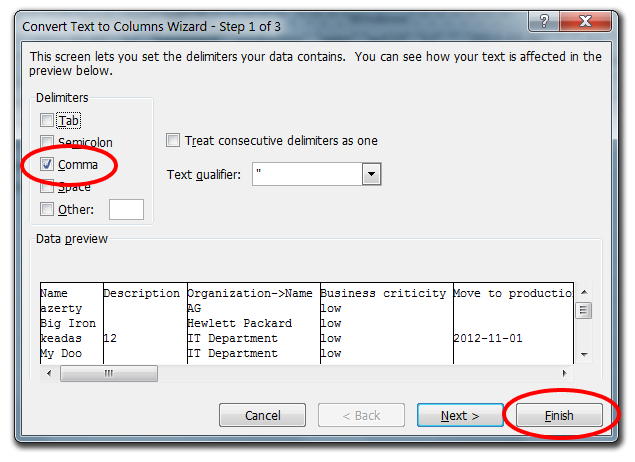
Select “Comma” and click “Finish”.
Add To Dashboard
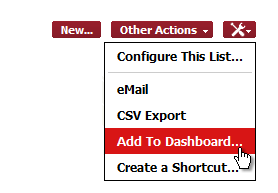
Every result displayed as a list can be added to one of the editable dashboards. Click on the menu “Add to Dashboard…”:
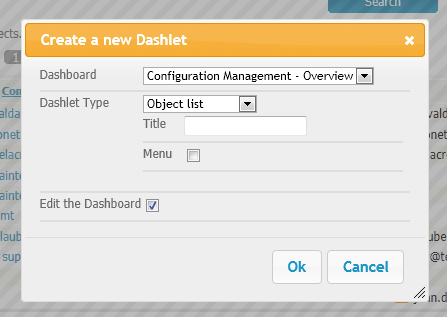
Then select the dashboard to which the list will be added and the type of “Dashlet” to use:
A list can be added to a dashboard either as:
-
A plain list of objects
-
A pie chart (By grouping the objects on a given field)
-
A barchart (By grouping the objects on a given field)
-
A table with the count of objects, grouped on a given field
When the user presses “Ok”, the new dashlet is added at the end of the selected dashboard (by adding a new cell after the last used cell). If “Edit the dashboard” is checked, then the modified dashboard is immediately opened in the dashboard editor.
Refer to Editing Dashboards for information about how to customize the resulting dashboard.


